The marketing metrics that matter are rarely the ones on the first screen. A field guide to reading past the easy numbers to the few that move revenue.
A shopkeeper in a busy market can count footfall all day. Hundreds walk past. Dozens step in. A few pick something up and put it back. None of it tells him how the day went. He finds that out at night, when he counts the cash drawer.
Most marketing dashboards are footfall counters. Impressions, reach, clicks, sessions, rankings. They are easy to collect, so they fill the screen. The marketing metrics that matter, the ones that tell you whether money came back, sit further down the page, or are missing altogether.
This piece opens the measurement chapter of the series that began with Same War, New Weapons. It borrows two old ideas. Sun Tzu wrote that the general who wins makes many calculations before the battle, and the general who loses makes few. Morgan Housel’s Same as Ever keeps returning to a quieter point: the biggest risks are the ones nobody is looking at. A dashboard is where you make your calculations. It is also where the unseen risk hides.
WHY DASHBOARDS DRIFT
Easy numbers crowd out useful ones
Every tool shows you what it can count, not what you need to know. Ad platforms count impressions and clicks. Analytics counts sessions and page views. Rank trackers count positions. None of them can see a sale that closes on a phone call three weeks later, unless someone connects the two.
So dashboards drift toward the easy. The numbers that are free to collect get the big tiles. The numbers that take work, like cost per qualified lead, lead-to-sale rate, and revenue by channel, get a small table on page four, or no table at all.
There is an old name for what happens next. Goodhart’s law says that when a measure becomes a target, it stops being a good measure. Chase clicks and you will get clicks. Chase rankings and you will get rankings. Whether you get customers is a separate question, and the dashboard will not ask it for you.
FROM THE WORK
Page one, and almost nobody saw it
Here is what that gap looks like in a real account. An electric-vehicle information website we work with tracks about 20 keywords every week. By July 2026, the rank tracker showed the site on page one for 11 of them. Some sat at position 3 or 4 every single week. On a dashboard, that is a success story.
Then we searched for those keywords ourselves. The site was not there.
So we put two numbers side by side for each keyword: how many people search for it in a month, and how many times the site actually appeared in those searches, taken from Search Console. Across the 11 page-one keywords, there were about 3.94 lakh searches in July. The site appeared 1,377 times. That is 0.35 percent of the searches it was supposedly ranking for.
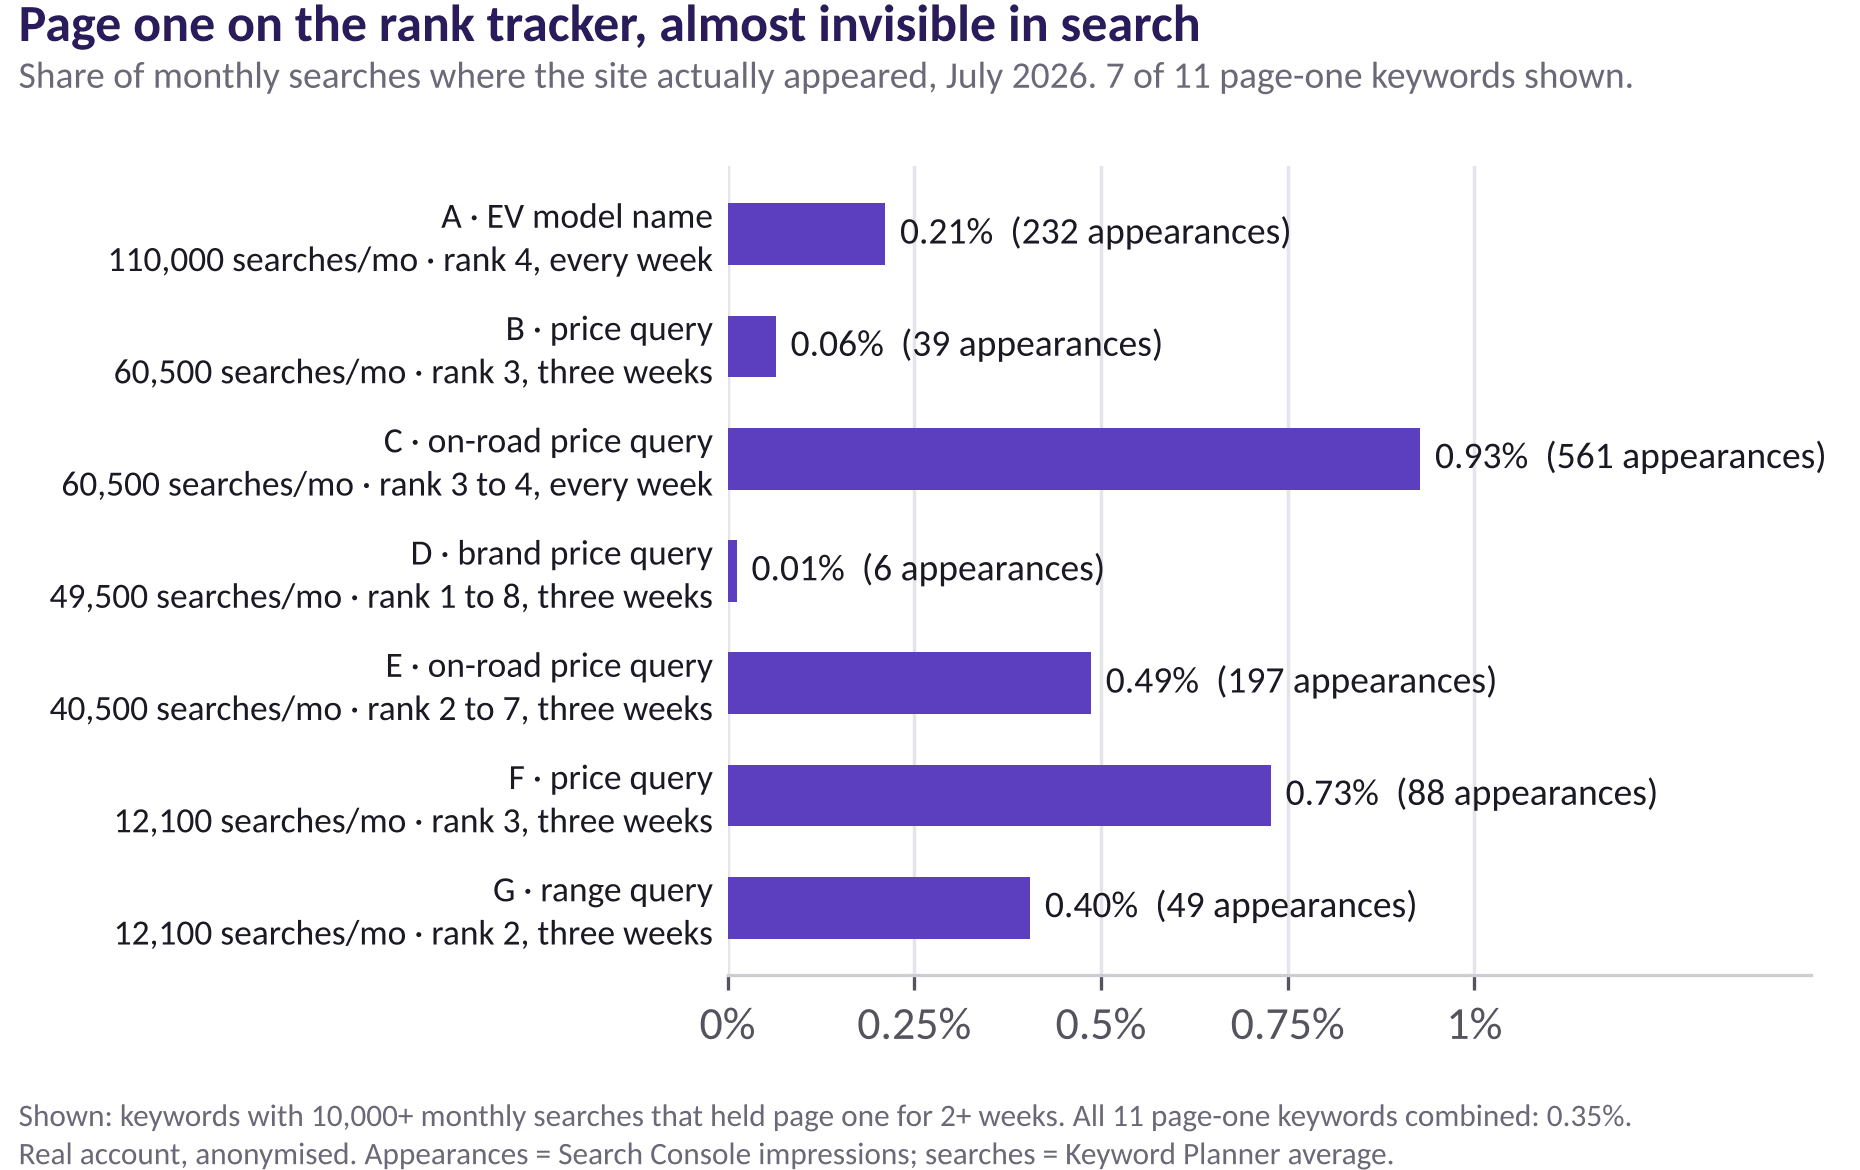
One keyword with about 1.1 lakh monthly searches held position 4 all month and appeared 232 times. Another reached position 1 for a week and appeared 6 times. The rank was real. It just was not the rank most searchers saw.
The pattern flipped on the smallest keywords. A comparison query with about 480 monthly searches ranked between 3 and 6 and appeared 169 times, about a third of all searches. Small, specific keywords turned a ranking into visibility. The big head terms did not.
Why the gap? A rank check is a snapshot. It looks at one search, from one location, on one device, at one moment. Search Console counts an impression each time the site appears on a page of results a real person is looking at. When the two disagree by a factor of a hundred, the snapshot is the one that is wrong. The weekly data showed it too: several keywords jumped from position 100 to position 2 and back again within a month. That is not a position. It is a flicker.
How to tell a real ranking from a flicker
- Put impressions next to search volume. If a page-one keyword appears in only a sliver of its monthly searches, the ranking is not stable.
- Read rank as a trend, not a number. Look at several weeks together. A rank that jumps between 2 and 100 is not a rank you own.
- Search the way your buyers do. Logged out, from the city and on the device they use.
- Follow the keyword down to leads. A keyword that ranks and appears but never converts is still a vanity number.
Search volume from Keyword Planner is itself an estimate, so treat the share as a direction, not a precise figure. But when the direction is 0.35 percent, you do not need precision to know something is off.
SAME MONTH, TWO READINGS
Two dashboards, one set of numbers
It is worth seeing how differently the same month reads depending on what the dashboard chooses to show.
The first dashboard, the one most teams build, says this: 11 tracked keywords on page one in July, up from none in May. Organic search users up from 8 in March to 1,648 in July. Every line points up and to the right. The natural conclusion is to keep doing exactly what we are doing.
The second dashboard uses the same data and adds one column. It says: we appeared in 0.35 percent of the searches for our page-one keywords. Our biggest head terms barely showed us at all. The keywords that did turn rank into visibility were small, specific, and closer to a buying decision. The natural conclusion here is different: stop celebrating the head-term rankings, build more pages around specific questions buyers actually ask, and track share of searches every month alongside rank.
Neither dashboard is false. The traffic growth was real and worth celebrating. But only the second one tells you where the next month of effort should go. That is the test of any dashboard: not whether the numbers are right, but whether they point you at the right work.
THE THREE LAYERS
The marketing metrics that move revenue
It helps to sort every number on a dashboard into three layers, and to be clear about which layer it belongs to.
Layer one: reach, the context
Impressions, reach, rankings, sessions. Useful for spotting problems. They tell you whether you were in the room. They do not tell you whether anyone listened.
Layer two: intent, the signal
Impression share on the keywords that sell, click-through rate on search, landing page conversion rate, qualified lead rate. These tell you whether the right people are paying attention.
Layer three: revenue, the verdict
Cost per qualified lead, lead-to-sale rate, revenue or pipeline by channel, payback period. These tell you whether the money came back. They are the hardest to collect, and the only ones the business actually runs on.
Swap the easy number for the useful one
| Metric | What it hides | Track this instead |
|---|---|---|
| Impressions | Whether the right people saw it | Impression share on the keywords that sell |
| Rankings | How often you actually appear | Search Console impressions and clicks per keyword |
| Clicks and CTR | Whether visitors could buy | Landing page conversion rate |
| Sessions | Broken or duplicate sessions | Key events: form fills, calls, chats |
| Leads | Whether the leads were real | Qualified lead rate and lead-to-sale rate |
| Cost per lead | Lead quality | Cost per qualified lead and cost per sale |

BUILDING IT
Build the dashboard around one question
Most dashboards answer twenty questions badly. A good one answers one question well: did marketing make money this month? Everything else either supports that answer or moves to a second page.
In Looker Studio, that usually means a first page with four tiles: spend, qualified leads, cost per qualified lead, and revenue or pipeline from marketing. Below them, one chart of those numbers over time and one table by channel. Reach and traffic go on page two, labelled as diagnostics.
The hard part is not the chart. It is the plumbing. GA4 needs the right key events marked, not every click. Leads from calls and chats need tracking, or the dashboard will quietly undercount the channels that drive them, the exact problem we covered in The Leads You’re Losing to Tracking You Can’t See. And revenue usually lives in a CRM or a sales sheet, so it has to be brought in, even by hand once a month, before the top row means anything.
WHAT THE TOOLS MISS
What GA4 and Looker Studio cannot see
Be clear about the blind spots, or the dashboard will quietly fill them with confidence.
- Offline influence. A TV spot, a hoarding, a friend’s recommendation. GA4 records the visit, not the reason for it.
- The sale itself. Unless revenue is imported, the dashboard ends at the lead.
- Lead quality. A form fill from a student and a form fill from a buyer count the same.
- The searches you miss. Dashboards report where you appear. The searches where you never show up do not appear anywhere.
None of this is a reason to distrust the data. It is a reason to know where the data ends.
THE ROUTINE
A monthly reading routine
- Start at the bottom. Read revenue and cost per sale before you read traffic.
- Check the pipes. Are key events firing? Did any source jump suddenly? A spike in direct traffic is often a tagging gap, not a sudden rise in fame.
- Compare, do not just read. This month against last month, and against the same month last year.
- Ask one question of every number. What would I do differently if this moved 20 percent?
- Write down one decision. A dashboard that never changes a decision is decoration.
A number is only useful if it can change what you do next.
The Decision Rule
If a metric went up 20 percent tomorrow and you would not change anything, it does not belong on page one. Keep it, label it as a diagnostic, and give its space to a number that decides where the next rupee goes.
The dashboard is not lying. It is answering the questions it was built to answer, and most dashboards were built to count activity. Rebuild yours around the cash drawer. Count the footfall too, but know which number tells you how the day went.
Download the metrics-that-matter reference sheet
. A one-page map of which metrics belong in reach, intent, and revenue, and what to track instead of each easy number.
Download: Download the metrics-that-matter reference sheet
Not sure your dashboard is telling the truth?
We set up GA4 and Looker Studio reporting that connects spend to leads and revenue, not just traffic.
→ Talk to us about analytics setup
Research referenced: Google Search Console Help on impressions and position; writing on Goodhart’s law; search data from an electric-vehicle information website, March to August 2026, anonymised.
Part of the Same War, New Weapons series on the marketing principles that survive every platform update.