
Marketing dashboards make cheap leads look efficient.
The cost per lead falls from ₹1,500 to ₹500. The graph turns green. The campaign gets more budget. The weekly report calls it a win.
Sales experiences something else. The new leads do not answer. Their requirements are outside scope. They cannot afford the service. They are students, jobseekers, vendors or people collecting prices. Representatives spend hours calling, researching, updating the CRM and writing proposals for opportunities that never existed.
The campaign is cheap only because the dashboard stops counting too early.
Cost per lead measures what marketing paid to create a contact. It does not measure the cost of qualifying that contact, the sales capacity it consumes, the probability of closing, the cost of onboarding, the gross profit of the resulting customer or the opportunity cost of ignoring better prospects.
The cheapest lead is not the one with the lowest form-fill cost. It is the one that creates the most profitable customer value for the least total commercial effort.
That is the invisible lever behind lead generation. The visible number is CPL. The business result is lead economics.
The short answer: should you optimise for cost per lead or lead quality?
Optimise for profitable customer acquisition, not cost per lead alone. Track the complete chain from media cost to qualified opportunity, sales effort, close rate, onboarding cost, gross margin and retention. A higher-cost lead is economically better when it qualifies more often, closes at a higher rate, needs less sales effort and produces stronger customer value.
The minimum measurement chain is:
- cost per lead;
- qualification rate;
- cost per qualified lead;
- sales hours per opportunity;
- close rate;
- media and labour cost per customer;
- gross profit and retention by source.
If marketing can see only the first number, it cannot optimise the business outcome.
CPL is not wrong. It is incomplete.
Cost per lead is useful for diagnosing advertising efficiency. It helps compare creative, keyword, audience, landing page and form performance. The mistake is allowing it to become the final success metric.
Imagine two campaigns.
Campaign A generates 200 leads at ₹500 each. Campaign B generates 80 leads at ₹1,500 each. On a lead-volume report, A looks better: more than twice the leads at one-third of the unit cost.
But suppose A closes 5% and B closes 20%.
- Campaign A: ₹500 ÷ 5% = ₹10,000 media cost per customer.
- Campaign B: ₹1,500 ÷ 20% = ₹7,500 media cost per customer.
The “expensive” lead produces a customer for 25% less media spend. That is before counting sales effort.
Now suppose Campaign A's team must process 20 leads to win one customer, while Campaign B needs five. If each early qualification attempt takes 15 minutes, A consumes five hours just at the first screening stage per win; B consumes 1.25 hours. Add discovery, follow-up and low-probability proposals, and the gap widens.
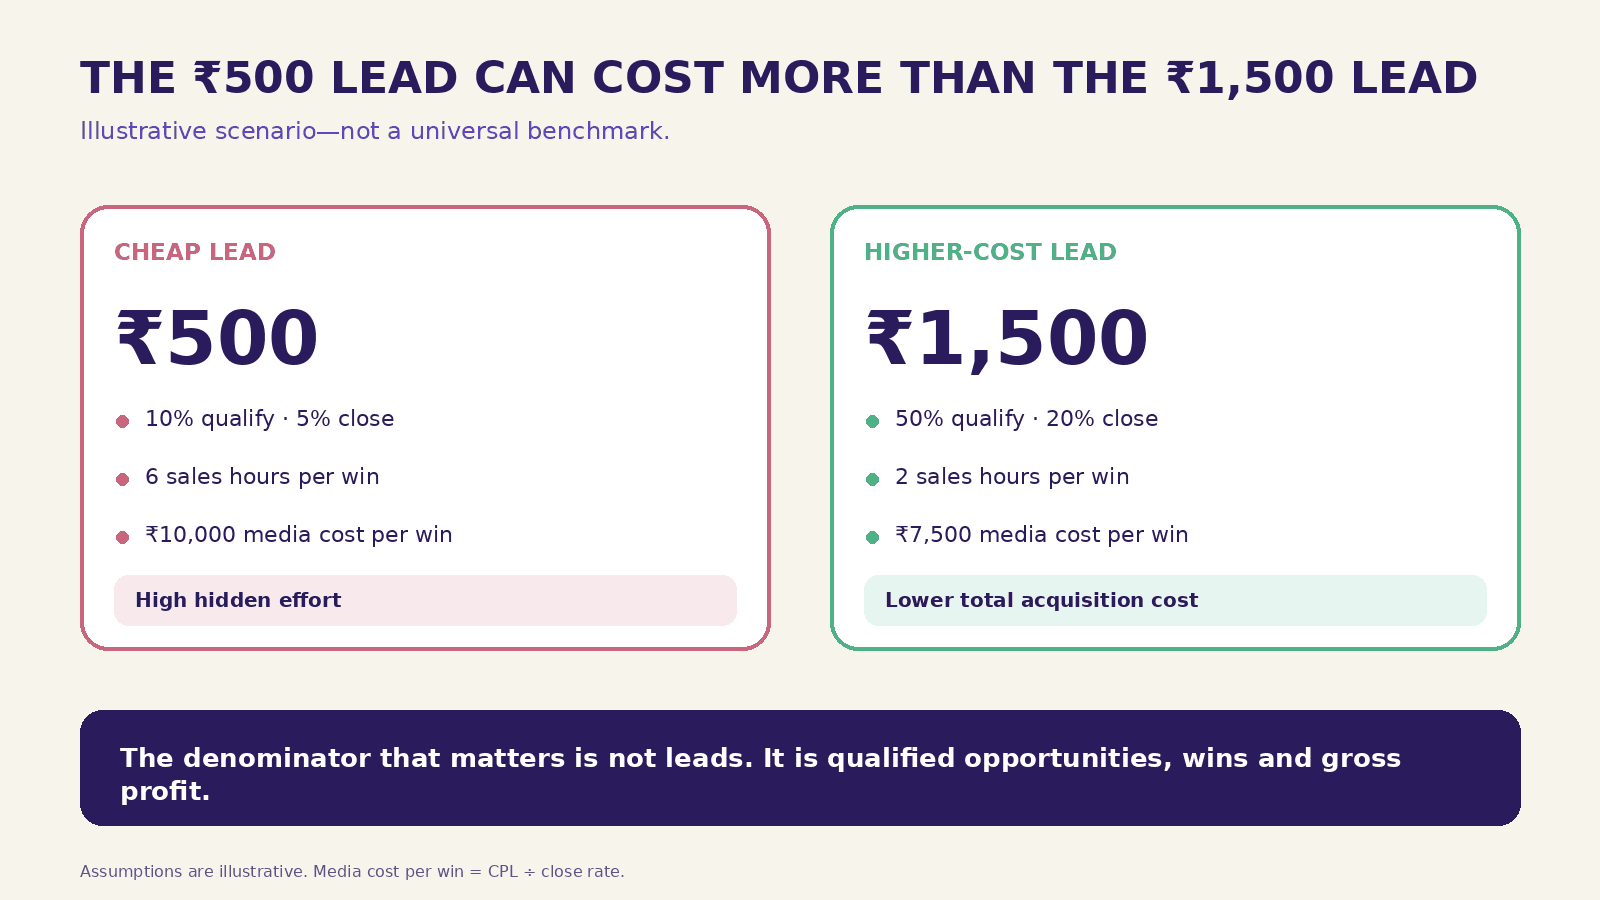
These figures are illustrative, not benchmarks. Their purpose is to expose the denominator. A low CPL can coexist with a high cost per sale.
The formulas that change the conversation
Cost per qualified lead = total campaign cost ÷ qualified leads
Cost per sales opportunity = total campaign cost ÷ accepted opportunities
Media cost per customer = cost per lead ÷ lead-to-customer close rate
Sales labour cost per customer = sales hours attributable to the source × loaded hourly sales cost ÷ customers won
Total acquisition cost = media + marketing operations + qualification + sales labour + onboarding incentives + attributable tools and agency cost
Customer contribution = revenue minus delivery cost, discounts, refunds and variable support cost
Acquisition payback = total acquisition cost ÷ monthly customer contribution
Every business will allocate overhead differently. The exact accounting convention matters less than using the same convention across sources and carrying the measurement past the form submission.
The lead-economics chain
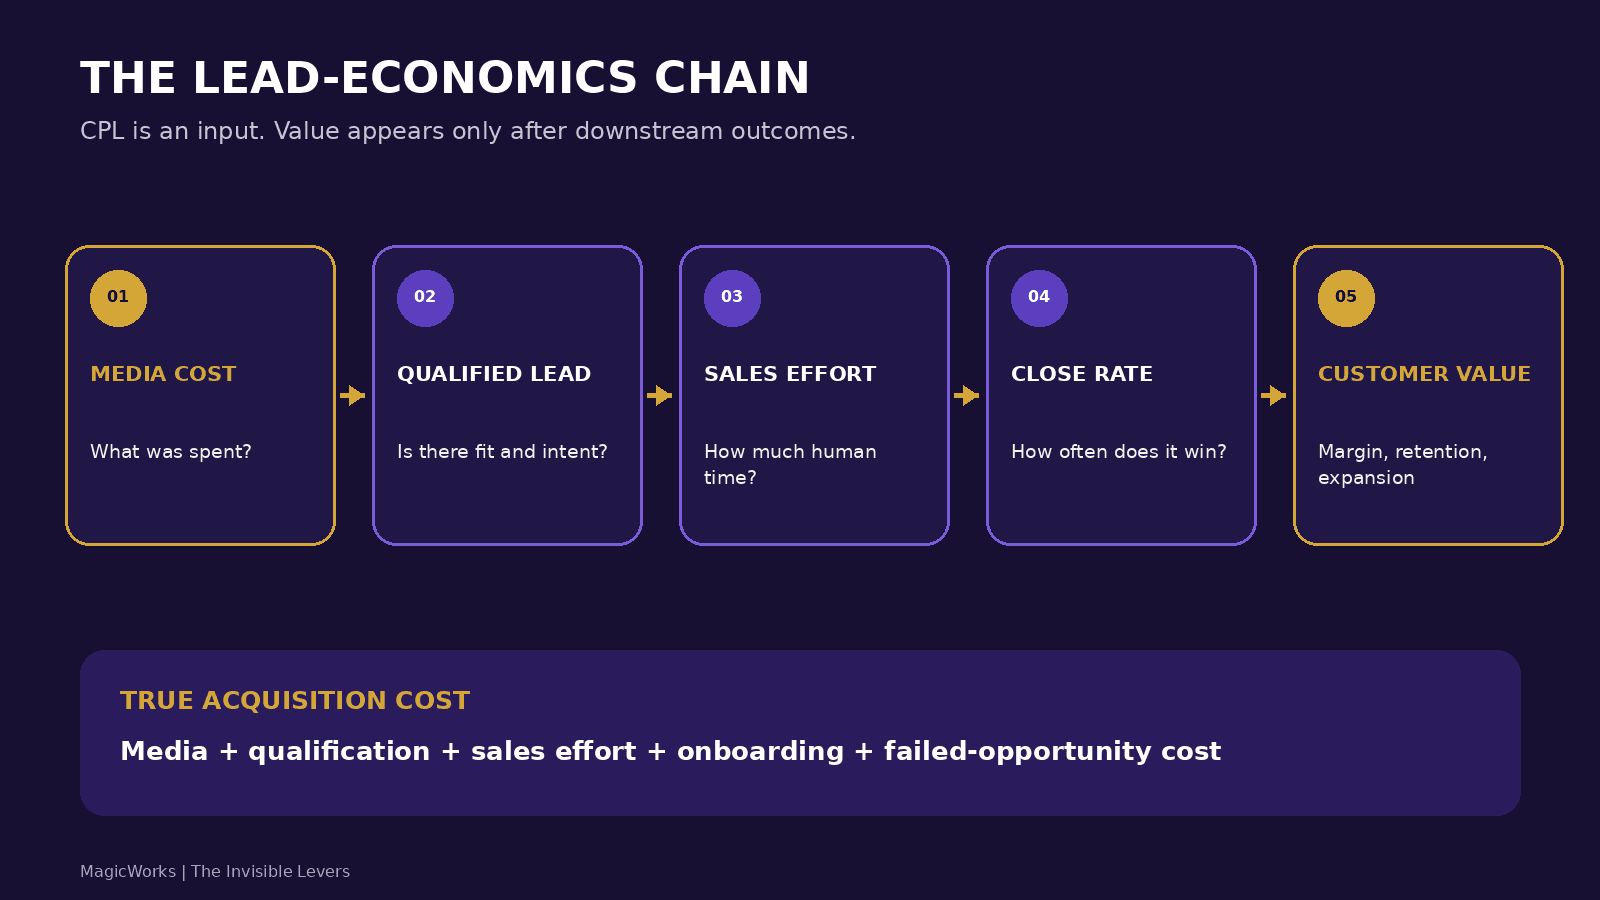
1. Media cost: what did attention cost?
Start with spend, clicks, sessions and lead conversion. These show how well the campaign captured attention and converted it into identifiable demand.
But segment by the signals that can affect quality: search term, audience, campaign, creative promise, landing page, device, geography and time. “Google Ads lead” is too broad to learn from. A branded search, an urgent problem query and a broad informational query can produce completely different economics.
2. Qualification: did a real opportunity exist?
A qualified lead has a credible combination of fit, need, intent, authority, economics and readiness. Not every field must be known immediately, but the organisation needs a shared definition.
Qualification should not mean “sales liked it”. It should be observable enough that marketing, sales and leadership can audit it. Typical disqualifiers include:
- wrong customer segment;
- requirement outside service scope;
- geography or timing the business cannot serve;
- no meaningful business problem;
- no access to a decision process;
- budget structurally below the viable level;
- duplicate, spam, vendor or job enquiry;
- no consent or unreachable contact data.
Do not treat nurture-ready prospects as bad leads. Separate “not now” from “never a fit”. A serious prospect planning for the next quarter belongs in a lifecycle, not in the rejected bucket.
3. Sales effort: what human capacity did the lead consume?
Sales time is a real acquisition cost even when it does not appear on the advertising invoice.
Salesforce's 2024 State of Sales research, based on 5,500 sales professionals in 27 countries, found that representatives reported spending 70% of their time on non-selling tasks. That statistic covers more than lead qualification, but it illustrates how limited genuine selling capacity is. Flooding the team with weak leads converts marketing waste into sales administration.
Track effort by stage:
- attempts to make first contact;
- research before discovery;
- discovery-call time;
- internal solutioning;
- demonstrations;
- proposal and estimate preparation;
- follow-up;
- rework caused by incomplete information;
- handoff and onboarding.
You do not need invasive minute-by-minute monitoring. A simple activity standard or sampled time study can reveal the difference between sources. If one channel needs three times more touches per qualified opportunity, its cheap CPL is borrowing capacity from sales.
4. Close rate: did the lead become revenue?
Calculate conversion using consistent stages and time windows. A 90-day sales cycle cannot be evaluated from last week's leads. Use cohorts: leads created in a given month and their outcomes after an appropriate maturation period.
Separate at least:
- lead to contacted;
- contacted to qualified;
- qualified to accepted opportunity;
- opportunity to proposal;
- proposal to won;
- won to successfully onboarded.
One blended close rate hides where the system fails. Marketing may be producing suitable demand while response is slow. Sales may accept too many weak opportunities. Proposals may be generic. Pricing may be misaligned. Attribution should support diagnosis, not blame.
5. Customer value: did the win create a good customer?
The final test is not the signed contract. Some customers buy once and require disproportionate support. Some churn before acquisition cost is recovered. Some pay slowly. Others expand, refer peers and become reference accounts.
Compare by acquisition source:
- gross margin;
- payment behaviour;
- onboarding effort;
- support load;
- early churn;
- renewal or repeat purchase;
- expansion revenue;
- referral contribution;
- refund, dispute or cancellation rate.
A channel can produce fewer customers and more profit. That is not underperformance.
Why cheap-lead campaigns often become expensive
The message attracts curiosity instead of intent
“Free consultation”, “lowest price” or a broad educational promise can increase conversion while weakening self-selection. The campaign delivers what it was asked to deliver: more form fills. The brief never asked for economic fit.
The form removes useful friction
Fewer fields often improve completion rate. But friction is not automatically bad. The right friction helps serious buyers describe the problem and discourages irrelevant submissions.
The goal is appropriate friction. Ask only what will change routing or the next conversation. For a B2B service, requirement, company, role, urgency and approximate budget band may be more valuable than a long demographic form. For an emergency service, phone and location may matter more than company detail.
Platforms optimise the event you feed them
If an ad platform receives “form submitted” as the primary conversion, it will learn which users are likely to submit forms. It does not know which submissions become profitable customers unless offline outcomes are returned accurately.
When possible, send deeper lifecycle signals: qualified lead, opportunity created and customer won. Keep consent, platform policy and data governance intact. Do not upload sensitive detail that is unnecessary for optimisation.
Marketing and sales use different definitions
Marketing reports every valid form. Sales counts only meetings. Leadership counts proposals. Nobody reconciles the transitions. The result is not a data problem alone; it is an operating-agreement problem.
Create one funnel dictionary. For every stage, define:
- entry condition;
- owner;
- required fields;
- service-level expectation;
- exit condition;
- rejection reasons;
- the date used for cohort reporting.
Slow response destroys intent
Some leads are poor when sales receives them. Others become poor while waiting. The well-known Harvard Business Review article “The Short Life of Online Sales Leads” was published in 2011, so its context is dated, but its central warning remains operationally relevant: companies were often too slow to respond to online enquiries.
Measure lead age at first meaningful attempt, contact rate by response-time band and time to the next useful action. Automation can acknowledge and route. It should not pretend that an automated email is a meaningful sales response.
The practical lead-quality scorecard
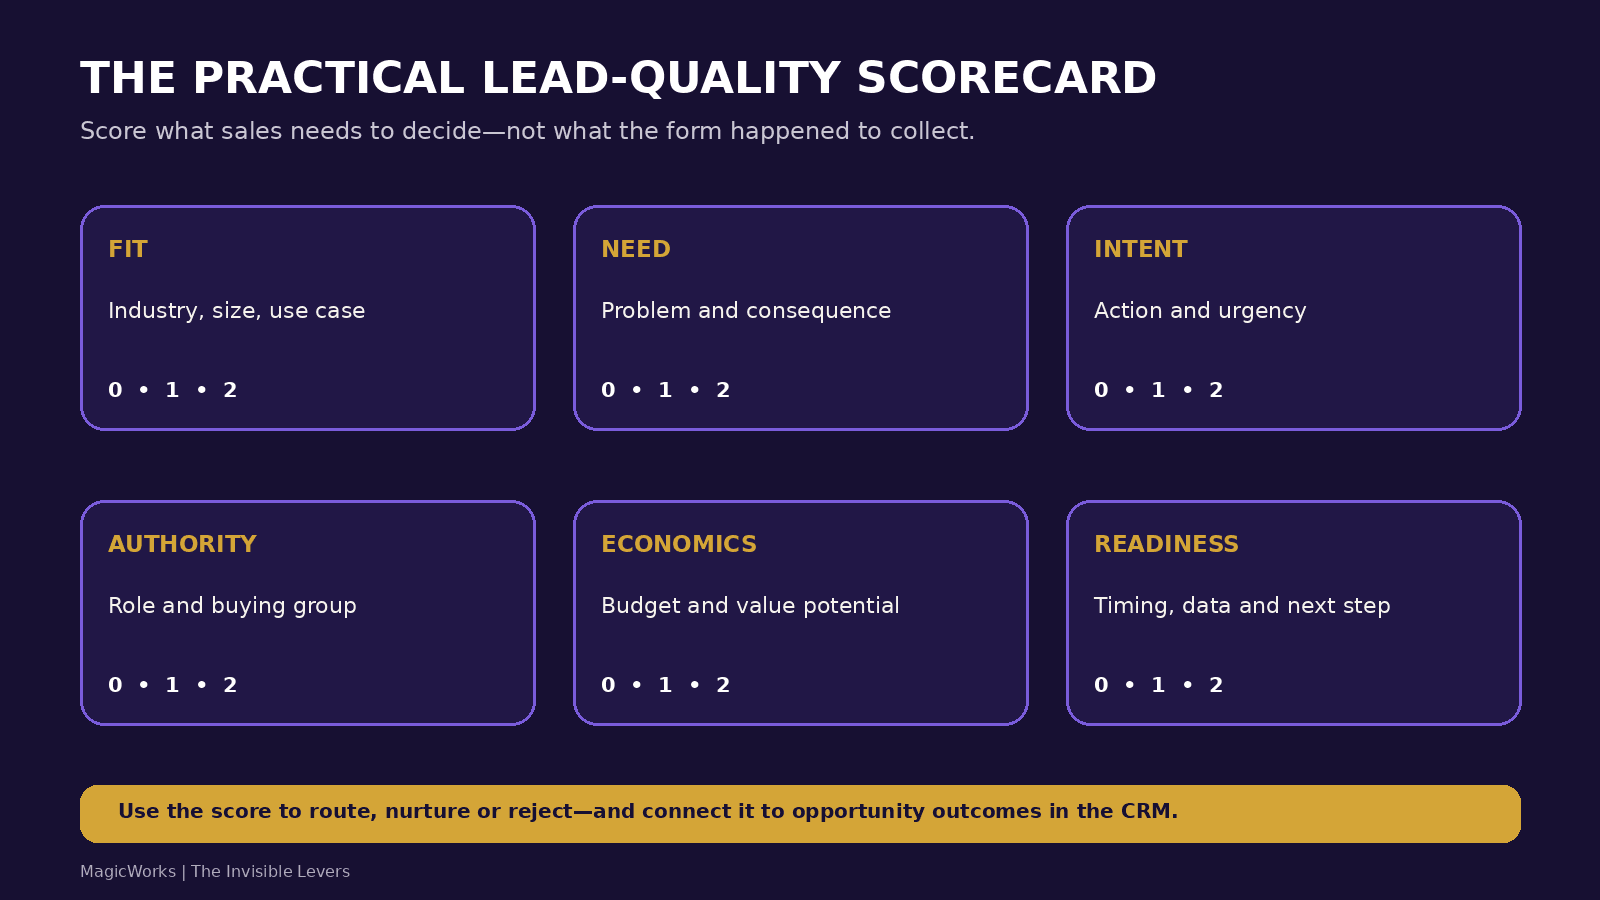
Use a simple 0–2 scale for six dimensions. The score does not replace judgment; it makes judgment discussable.
| Metric | Weaker signal (0–1) | Strong signal (2) |
|---|---|---|
| Fit | 0 – Outside ICP or service area / 1 – Partial fit or unclear | 2 – Strong ICP and service fit |
| Need | 0 – No defined problem / 1 – General interest or mild pain | 2 – Specific problem with consequence |
| Intent | 0 – Passive browsing / 1 – Comparing or researching | 2 – Requested action or urgent next step |
| Authority | 0 – No route to decision / 1 – Influencer or unknown group | 2 – Decision-maker or clear buying process |
| Economics | 0 – Structurally unviable / 1 – Unknown or needs validation | 2 – Viable budget/value relationship |
| Readiness | 0 – No timeline or prerequisites / 1 – Later-stage nurture | 2 – Conditions and timing support action |
Maximum score: 12.
One practical routing model:
- 0–3: reject, self-serve or redirect;
- 4–6: nurture and enrich;
- 7–9: sales development review;
- 10–12: priority response.
Do not deploy these thresholds blindly. Back-test them against real wins and losses. In some markets, authority is discovered late. In others, compliance or geography should be a hard gate regardless of total score. A scorecard is valuable only when it predicts downstream outcomes.
Add reason codes, not just scores
A single number hides the action. A score of six could mean excellent fit but no timing, or urgent intent but no economic viability. Store the six component scores and a primary status reason.
Reason codes make optimisation possible:
- campaign attracts wrong geography → tighten location targeting;
- good fit, no immediate need → create nurture content;
- strong need, low budget → revisit offer or minimum deal size;
- suitable lead, slow contact → fix routing and capacity;
- many vendor/job enquiries → separate navigation and forms;
- high-score leads lost after proposal → inspect offer, proof and sales process.
A worked example: ₹500 leads versus ₹1,500 leads
Consider a Pune-based technology services company comparing two monthly campaigns. These numbers are hypothetical.
Campaign A: low-CPL lead generation
- Spend: ₹1,00,000
- Leads: 200
- CPL: ₹500
- Qualified leads: 20 (10%)
- Customers: 10 (5% of leads)
- Media cost per customer: ₹10,000
- Estimated sales time per customer won: 6 hours
- Average first-year customer contribution: ₹60,000
Campaign B: narrow high-intent acquisition
- Spend: ₹1,20,000
- Leads: 80
- CPL: ₹1,500
- Qualified leads: 40 (50%)
- Customers: 16 (20% of leads)
- Media cost per customer: ₹7,500
- Estimated sales time per customer won: 2 hours
- Average first-year customer contribution: ₹90,000
Campaign A wins the CPL contest. Campaign B wins the business contest.
If loaded sales cost is ₹1,000 per hour, estimated media-plus-sales cost per win becomes:
- Campaign A: ₹10,000 + ₹6,000 = ₹16,000
- Campaign B: ₹7,500 + ₹2,000 = ₹9,500
Before onboarding differences, Campaign B's acquisition cost is roughly 41% lower. Its contribution-to-acquisition ratio is also much stronger:
- Campaign A: ₹60,000 ÷ ₹16,000 = 3.75
- Campaign B: ₹90,000 ÷ ₹9,500 ≈ 9.47
The figures are deliberately simple. A real model should include agency cost, tools, management allocation, discounts, bad debt, delivery margin and retention. The point is not the ratio itself. The point is that a CPL dashboard could recommend the wrong campaign.
How to build a lead-economics dashboard
Join source data to CRM outcomes
Capture campaign, source, medium, landing page, keyword or audience identifier, and click IDs where appropriate. Preserve the first meaningful source and the most recent converting touch if both matter to your model.
Then connect each lead to:
- qualification status and reason;
- opportunity status;
- expected and actual value;
- sales activity;
- win/loss reason;
- customer and onboarding status;
- contribution or margin where available.
Do not wait for perfect attribution. Start with a reliable source-to-outcome spine and document what remains unknown.
Review cohorts, not mixed-age pipeline
A September lead may close in November. Compare sources using cohorts old enough to mature or use stage conversion for recent cohorts with clear caveats.
Show volume and quality together
Do not replace one simplistic metric with another. Leadership needs:
- lead volume;
- CPL;
- qualification rate;
- cost per qualified lead;
- opportunity rate;
- close rate;
- cost per customer;
- sales effort;
- customer contribution.
A small channel with excellent economics may not have enough scale. A large channel with moderate economics may still be essential. The dashboard should support allocation, not crown one universal winner.
What current sales research reinforces
HubSpot's 2025 survey of more than 1,000 global sales professionals reported that 68% said lead quality had improved year over year, while fewer than 5% said they prioritised lead scoring among success measures. In the same report, no product fit and poor value for money were the two most frequently cited deal-killers, at 37% and 35% respectively.
Those are self-reported survey findings, not causal laws. But they reinforce a useful management point: teams say quality is improving while formal measurement of quality can remain weak.
Salesforce's 2024 study found that 86% of B2B buyers were more likely to purchase when companies understood their goals, while 59% said representatives did not take enough time to understand their unique challenges. Again, this is survey evidence. Its practical implication is strong: a pipeline full of poorly understood contacts is not a revenue engine.
A 30-day lead-economics reset
Week 1: define the shared funnel
- Agree on lead, qualified lead, accepted opportunity and customer.
- Create rejection and loss reasons.
- Set the response owner and time standard.
- Identify the sources and campaigns that must persist into the CRM.
Week 2: measure one mature cohort
- Select a recent cohort old enough to have meaningful outcomes.
- Reconcile lead count with CRM records.
- Calculate qualification, opportunity and close rates by source.
- Sample sales effort for good and poor leads.
Week 3: repair signal quality
- Update targeting and negative keywords.
- Align campaign promise with the actual offer.
- Add appropriate form friction.
- Fix routing, duplication and spam controls.
- Return qualified or won signals to ad platforms where appropriate.
Week 4: reallocate with guardrails
- Protect sources that generate profitable customers.
- Reduce spend where low CPL hides weak downstream conversion.
- Keep a controlled test budget.
- Schedule a monthly marketing-sales quality review.
The operating rule
Never celebrate a cheaper lead until you know what happened to it.
The business does not need marketing and sales to agree that every lead is good. It needs them to agree on evidence: who fits, who needs help, what effort was consumed, what closed, what created value and why.
Once those outcomes flow back to the campaign, optimisation becomes commercial. The team can decide whether to improve targeting, change the message, add friction, speed response, nurture earlier demand, coach sales or revise the offer.
Cost per lead still matters. It simply takes its proper place at the beginning of the chain.
Want fewer vanity leads and more accountable growth?
MagicWorks runs Digital Marketing across performance media, SEO/AEO, content, email and reporting with accountability to business outcomes rather than vanity metrics.
We can help connect acquisition data to qualification and downstream conversion, build a practical quality scorecard, repair campaign signals and create a measurement rhythm your marketing and sales teams can use together.
Book a discovery call to review where lead cost and lead value are diverging.
Part of The Invisible Levers series: the visible output gets attention; the less-visible system underneath often decides the result.